In this microservices era, many teams are building messaging solutions. What starts as a simple solution with 5 deployment units can quickly grow to tens or even hundreds. I have worked on such a solution for several years and experienced both the advantages and disadvantages of a Service-Oriented Architecture. We used NServiceBus (part of Particular’s Service Platform).
The solution started out simple, but, as the number of features grew, so did the complexity. With tens of message endpoints, it was hard to see both the big picture and the details. For the big picture, we could rely on some manually created diagrams (e.g. a Context View in Simon Brown’s C4 model). But things got trickier when we wanted to understand the details. When I talk about details, I mean answers to specific questions. For example:
- What messages does endpoint X send/receive?
- What endpoints are coupled to the X endpoint?
- What messages are part of the Y business flow?
- What messages is service Z sending?
- What messages trigger message W to be sent?
- Show me the entire message flow that starts with message W.
While I was thinking about this, I saw this interesting tweet from Jack Kleeman that showed the communication paths between microservices at Monzo:
Now, the system I worked on was nowhere near this complex, but it made me wonder: how can you answer the questions above when working on such a system? In this blog post we’ll explore some options. To keep things simple, in this blog post we’ll use a sample eCommerce solution (that I’ve also used in my article series about Designing long-running processes in distributed systems).
Messaging Basics
For a quick refresher on some of the terms I’ll use in this blog post, checkout these links:
Also, when I say service in this blog post, I use Udi Dahan‘s definition:
A service is the technical authority for a specific business capability.
Udi Dahan
Any piece of data or rule must be owned by only one service.
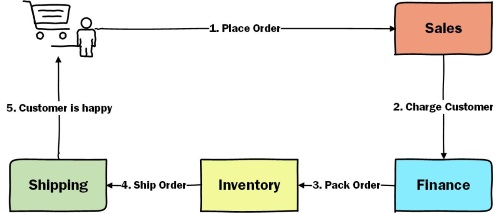
So a service is not a deployment unit (e.g. a Web API). Our classic eCommerce website could be split in the following services. Each service can contain many message endpoints.
Now, with the basics out of the way, let’s see how we can tackle this problem.
Static Diagrams
The easiest solution is to rely on static diagrams. You can draw these by hand or use a diagramming tool like Visio or draw.io. Here’s an example diagram for the Place Order flow:

Pros
- Easy to create. You can draw this one quite easily (especially if you can copy/paste components from other diagrams). You can also easily add them in your team’s wiki or knowledge base.
- Useful when designing a new feature. We found static diagrams really useful in the solution design phase, before writing the code. You can quickly draft a solution, request feedback and then update the diagrams based on the feedback.
Cons
- Useless after implementation – since you have to update them by hand, it takes time to keep them up to date. These won’t always be updated together with the code, so they can be misleading.
If we look at our list of questions, we can see that this type of diagrams only answers two questions:
- What messages are part of the Y business flow?
- Show me the entire message flow that starts with message W.
So, although useful, this is not enough. Maintaining these diagrams manually on a continuously evolving system is a huge pain in the ass. So let’s explore other options.
Generated Diagrams
If not manually, then let’s generate them.
Where’s my architecture?
The questions is, where should we generate them from? Where can we find the architecture of a message based system?
In the code
One option would be to look at the code. We were using NServiceBus, so the code was quite expressive. For example, the routing code for the Finance.Endpoint in our sample solution looks like this:
routing.RouteToEndpoint(typeof(ChargeCreditCardRequest), "ItOps.CreditCardProcessor.Gateway");
routing.RegisterPublisher(typeof(Sales.Messages.IOrderPlaced), "Sales.Endpoint");
This clearly states that the Finance.Endpoint sends the ChargeCreditCardRequest to the ItOps.CreditCardProcessor.Gateway endpoint and that it subscribes to the IOrderPlaced event published by the Sales.Endpoint.
Of course, this code doesn’t tell how the endpoint will handle the IOrderPlaced event. But, for that, you can look at the handling code. Here is how the Inventory.Endpoint handles this event.
public class OrderPlacedHandler : IHandleMessages<IOrderPlaced>
{
    public Task Handle(IOrderPlaced message, IMessageHandlerContext context)
    {
        return context.Publish<IOrderPacked>(m => { m.OrderId = message.OrderId; });
    }
}
By analyzing this code, you can infer that the Inventory.Endpoint publishes the IOrderPacked event when handling the IOrderPlaced event.
The main downside of this approach was that we needed to build the tools to extract the data from code ourselves. Although not hard, this wouldn’t be a trivial piece of work. But luckily for us, there was a simpler answer.
At Runtime
Instead of looking at the code, we could look at the messages that pass through the system. The message body might look like this.
<IOrderCharged>
    <OrderId>6ADA5443-E6F7-4A65-8F21-2BC83C4719D4</OrderId>
</IOrderCharged>
Although interesting, this isn’t what we’re looking for. But, if we look at the headers – which contain metadata about the message – then things start to look a lot more interesting. Let’s see what headers we get out of the box with NServiceBus.
"Headers": {
        "NServiceBus.MessageId": "a3bdad10-34d4-4c1e-b932-ab1000435b1b",
        "NServiceBus.MessageIntent": "Publish",
        "NServiceBus.RelatedTo": "f7d2f788-1523-4ff1-9b0f-ab1000435aff",
        "NServiceBus.ConversationId": "b4520bfa-e60b-4840-b538-ab1000435a6c",
        "NServiceBus.CorrelationId": "6dd74a0f-26f7-49fc-b96a-ab1000435a6c",
        "NServiceBus.OriginatingMachine": "DESKTOP-9DOREUQ",
        "NServiceBus.OriginatingEndpoint": "Finance.Endpoint",
        "$.diagnostics.originating.hostid": "b491715d021de132c7dbb35e91b73ec3",
        "NServiceBus.ReplyToAddress": "Finance.Endpoint@DESKTOP-9DOREUQ",
        "NServiceBus.ContentType": "text/xml",
        "NServiceBus.EnclosedMessageTypes": "MyShop.Finance.Messages.IOrderCharged, MyShop.Finance.Messages, Version=1.0.0.0, Culture=neutral, PublicKeyToken=null",
        "NServiceBus.Version": "7.2.0",
        "NServiceBus.TimeSent": "2019-11-25 04:05:14:116315 Z",
        "CorrId": "6dd74a0f-26f7-49fc-b96a-ab1000435a6c\\0",
        "NServiceBus.ProcessingStarted": "2019-11-25 04:05:14:134318 Z",
        "NServiceBus.ProcessingEnded": "2019-11-25 04:05:14:160314 Z",
        "$.diagnostics.hostid": "8190dc1d19e2e350e3cf07c2aa36f53a",
        "$.diagnostics.hostdisplayname": "DESKTOP-9DOREUQ",
        "NServiceBus.ProcessingMachine": "DESKTOP-9DOREUQ",
        "NServiceBus.ProcessingEndpoint": "Shipping.Endpoint"
    }
As you can see there’s a lot of useful information in here:
- EnclosedMessageTypes (line 12) – the message’s fully qualified type name. In this case it’s the MyShop.Finance.Messages.IOrderCharged type from the MyShop.Finance.Messages assembly.
- MessageIntent (line 3) – this tells us the intent of the message. In this case, this message is an event, because the MessageIntent is Publish.
- OriginatingEndpoint (line 8) – what endpoint sent this message. In this case, it was sent by Finance.Endpoint.
- ProcessingEndpoint (line 21) – what endpoint handled this message. In this case, it was processed by Shipping.Endpoint.
- MessageId (line 2) – a unique Id of the message.
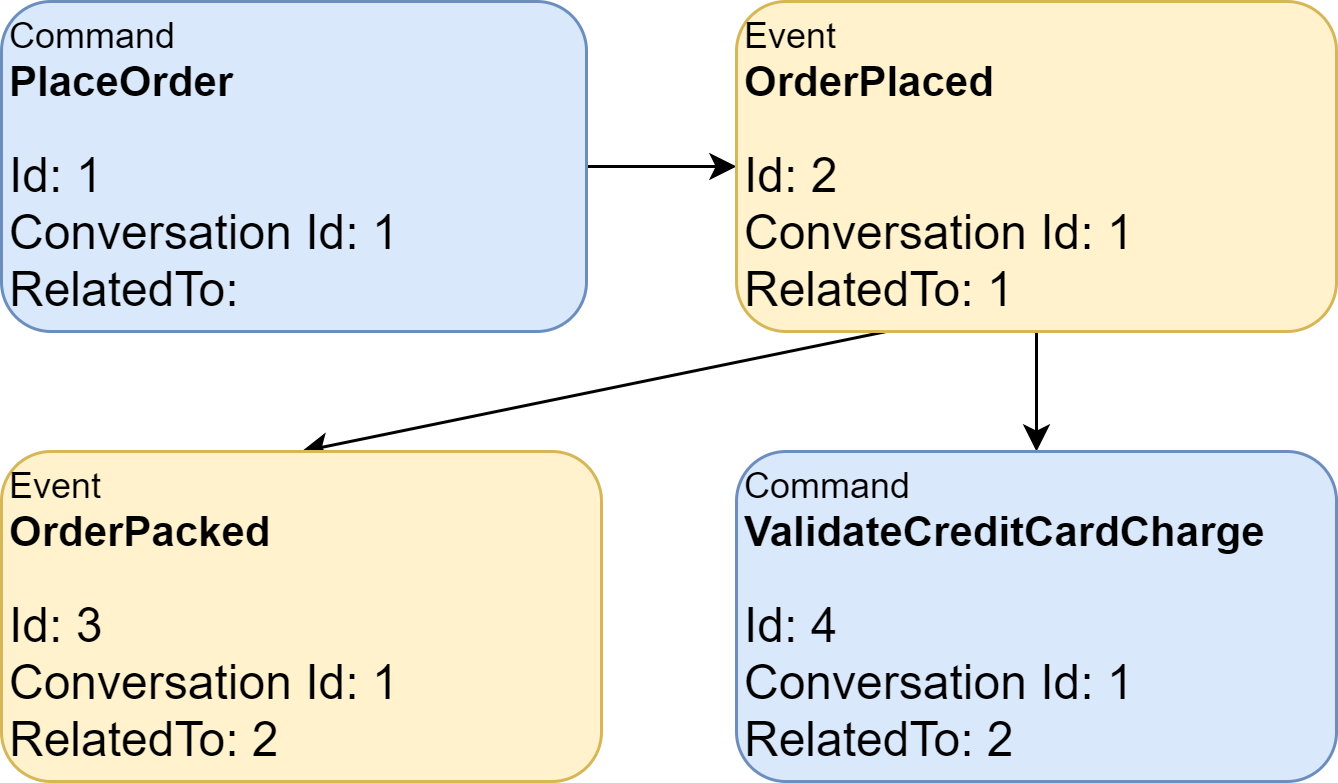
- RelatedTo (line 4) – this tells us the Id of the message that triggered the current message.
- ConversationId (line 5)- the unique Id of the conversation that this message is a part of.
The last three are especially useful since they allow us to understand the flow of messages. Using these conversation and causation headers, you can build a map like this:
Message Store
So now we know that we can use the information in the message headers to answer our questions. But How can we report against message information without disturbing the loosely coupled and transient nature of a messaging system? Well, the Enterprise Integration Patterns catalog has the answer to this question in the form of the Message Store pattern. Use a Message Store to capture information about each message in a central location. Luckily for us, this pattern is already implemented in Particular’s Service Platform in the form of the ServiceControl Audit instance:

After processing a message, each endpoint can send a copy of it to an audit queue. The ServiceControl Audit instance consumes messages off that queue and stores them (in a RavenDB database).
We now know where we can get that data from. But how can we use it?
ServiceInsight
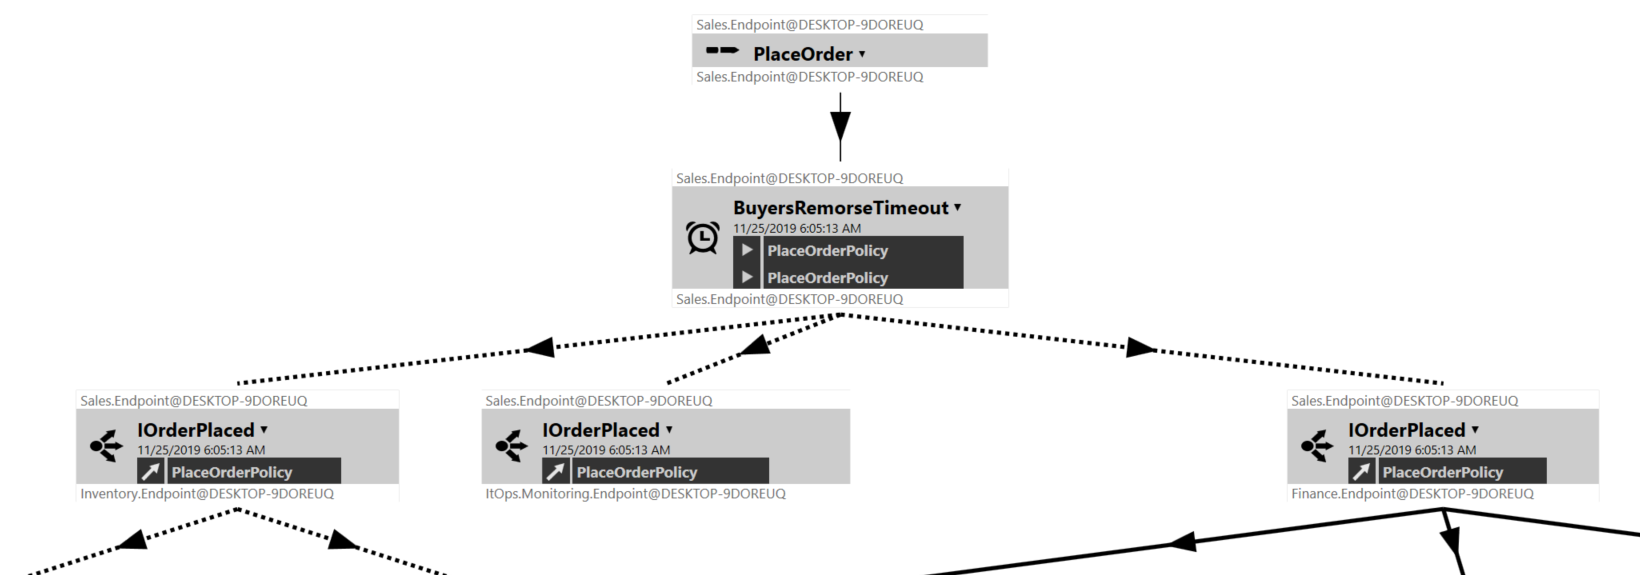
The easiest way to explore this data is to use ServiceInsight. This tool lets you visualize the messages that flow through your system. Here is, for example, a part of our place order flow:
Pros
- Out-of-the-box solution
- It’s always up to date.
- ServiceInsight is a very useful debugging tool. If something is not right, you can look at the flow of messages and the message content. This makes it a lot easier to investigate bugs and issues.
- You can see an entire conversation. When you search for a message, you can also see the full conversation. (Actually, when I’ve last used it there was a technical limitation – you could only the first 50 or 100 messages in a conversation. This was actually an issue for us, since we were running some batch processes that exceeded this limit).
Cons
- Service Insight is a debugging tool. Hence, it’s focused on conversations and its querying capabilities, although good, are limited. You can’t answer questions like: What endpoints are coupled to the X endpoint?
But, there’s another tool in the Particular Labs that does answer this type of question.
Routing Visualization
RoutingVisualization is a command line tool that uses audit data stored in ServiceControl to construct a visualization of endpoints and the messages being routed between them. This visualization takes the form of a DGML (Directed Graph Markup Language) file. (By the way, I found out about this tool from Mike Minutillo presentation – A picture is worth 1000 lines of code. In this talk, he presents some tools and techniques for visualizing complex software systems – really great stuff).
Here is the visualization for our sample eCommerce solution:
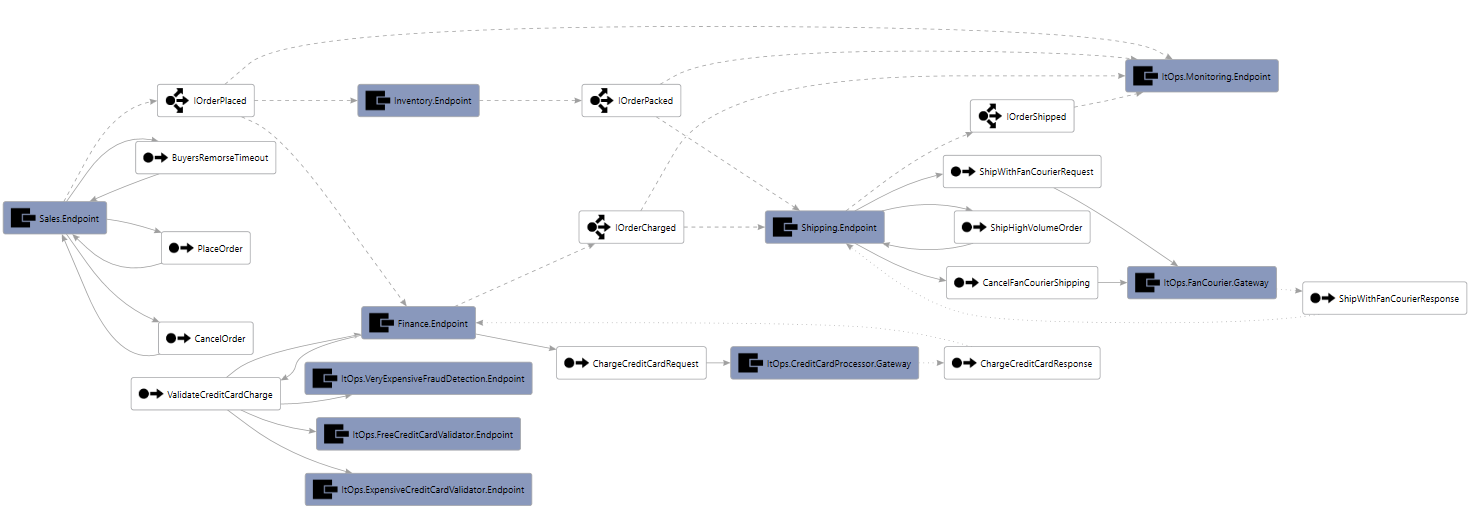
This can give you an overview of the messages that an endpoint is sending/receiving. Unfortunately, on a bigger system, the picture might look more like the one below. This makes it quite hard to explore and understand what’s going one.

Routing Visualization Architecture
The tool generates this visualization by going over the messages in the Service Control audit database (i.e. the message store). Here’s how:
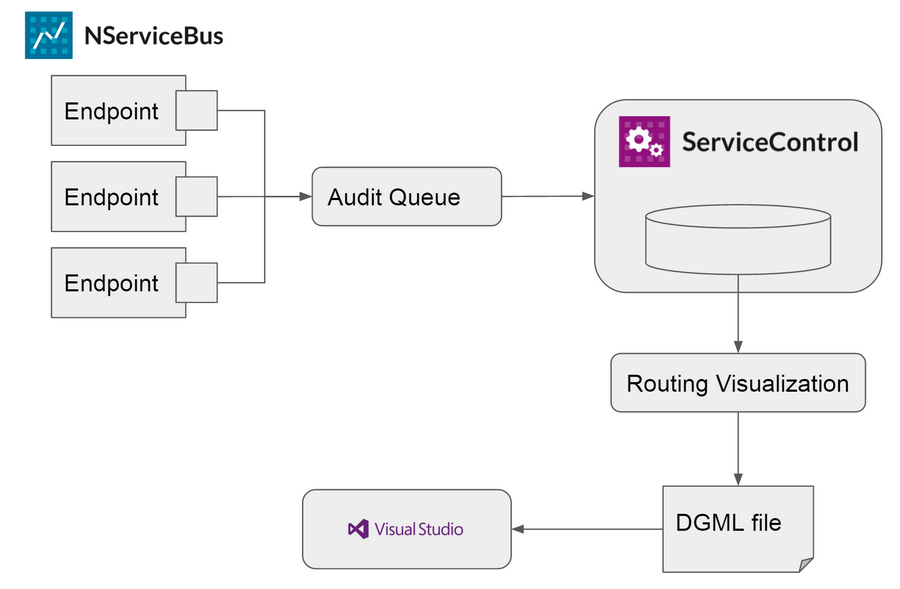
So, although not ideal on complex systems, this tool gave us an idea on how to move forward. Instead of generating a diagram, maybe we can generate an architecture model.
Runtime Generated Model
But first, what is an architecture model? A good way to describe it is to compare it with diagramming. Here are a couple of tweets from Simon Brown on this topic:
Choosing a model
So we decided to extract the data from ServiceControl and put it in a model that will help us answer the type of questions we’ve discussed:
- What messages does endpoint X send/receive?
- What endpoints are coupled to the X endpoint?
- What messages are part of the Y business flow?
- What messages is service Z sending?
- What messages trigger message W to be sent?
- Show me the entire message flow that starts with message W
To decide on what model we’ll use, we also had a look at the shape of data. What data model is a natural fit for this type of data – relational, document or graph? As you’ve might have guessed, we picked the graph data model.
Implementing the model
We picked Neo4j as the backing store for our model. It’s probably the most well-known graph database, it has good documentation, it’s easy to learn and its community edition is sufficient for this use case.
Neo4j uses the Labeled Property Graph Model. It’s a directed graph in which nodes can have labels and both nodes and relationships can have properties.
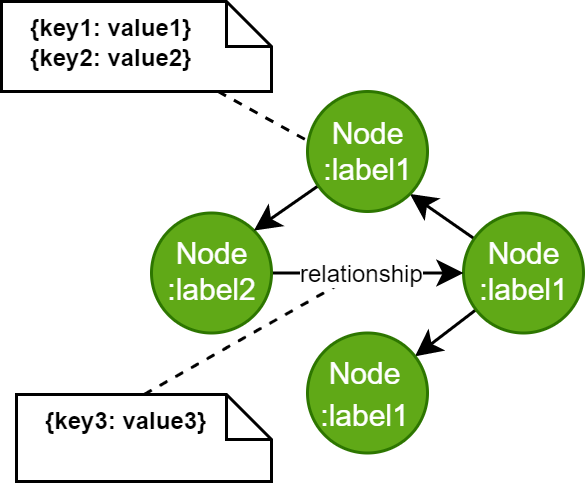
With this model in mind, we needed to decide how to model our problem. What schema should we use? After reading about schema design, this is what we ended up with:

With the schema defined, all that was left was to actually put the data in Neo4j. So, I played around a bit and adapted the Routing Visualization solution to import the data in Neo4j instead of a DGML file. I also changed the way messages are processed, since I wanted to add the causation (related to) relationship (which is not part of the Routing Visualization solution).
Using the model
The Cypher Query Language
This model allows us to ask questions. Neo4j uses the Cypher query language. This query language is based on ASCII art and is very expressive. Let’s see an example:
The question I want to get an answer to is:
What endpoints are coupled to the X endpoint?
If you’d model this question as a graph, using the schema defined above, it would look like this:

And, since you’re using Cypher, it actually looks like this:
MATCH
(e:Endpoint {id: 'X'})-[:SENDS]->(m:Message)<-[:RECEIVES]-(related:Endpoint)
RETURN related, m
I find it quite intuitive and easy to understand. You can also use the Neo4j Browser to explore the results, which is helpful. You can drag the nodes or click on them to find more details.

Interviewing you architecture
So let’s see how we can ask the questions that we’ve been talking about. After each query, I’ll also include a print screen of the results shown in the Neo4j Browser.
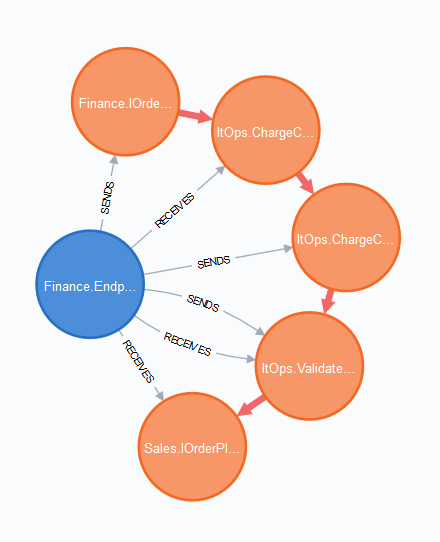
What messages does Finance.Endpoint send/receive?
MATCH (e:Endpoint {id:'Finance.Endpoint'})-[]->(m:Message)
RETURN e, m
Notice that we don’t specify the relationship type (-[]->) so it includes both send and receive.
What endpoints are coupled to the Finance.Endpoint endpoint?
MATCH (e:Endpoint {id:'Finance.Endpoint'})-[:SENDS]->(m:Message {intent:'Send'})<-[:RECEIVES]-(related:Endpoint)
RETURN related, m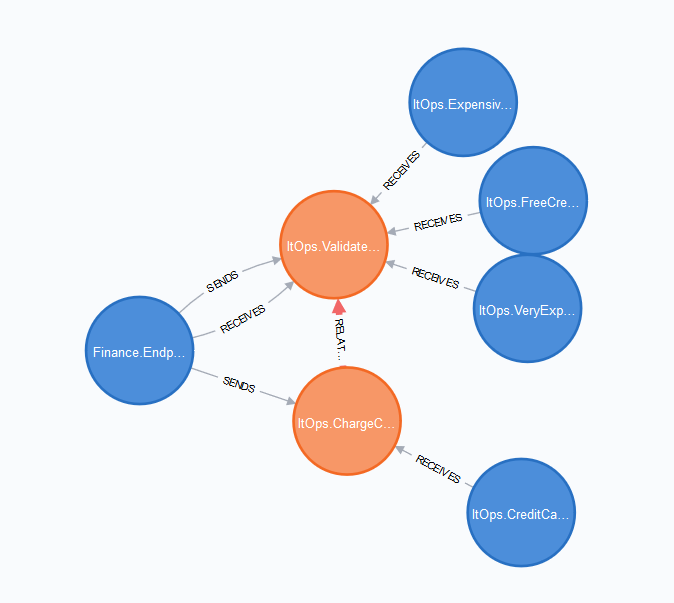
What messages are part of the Place Order business flow?
MATCH (c:Context {id: 'Place Order'})-[:CONTAINS]->(m:Message)
RETURN m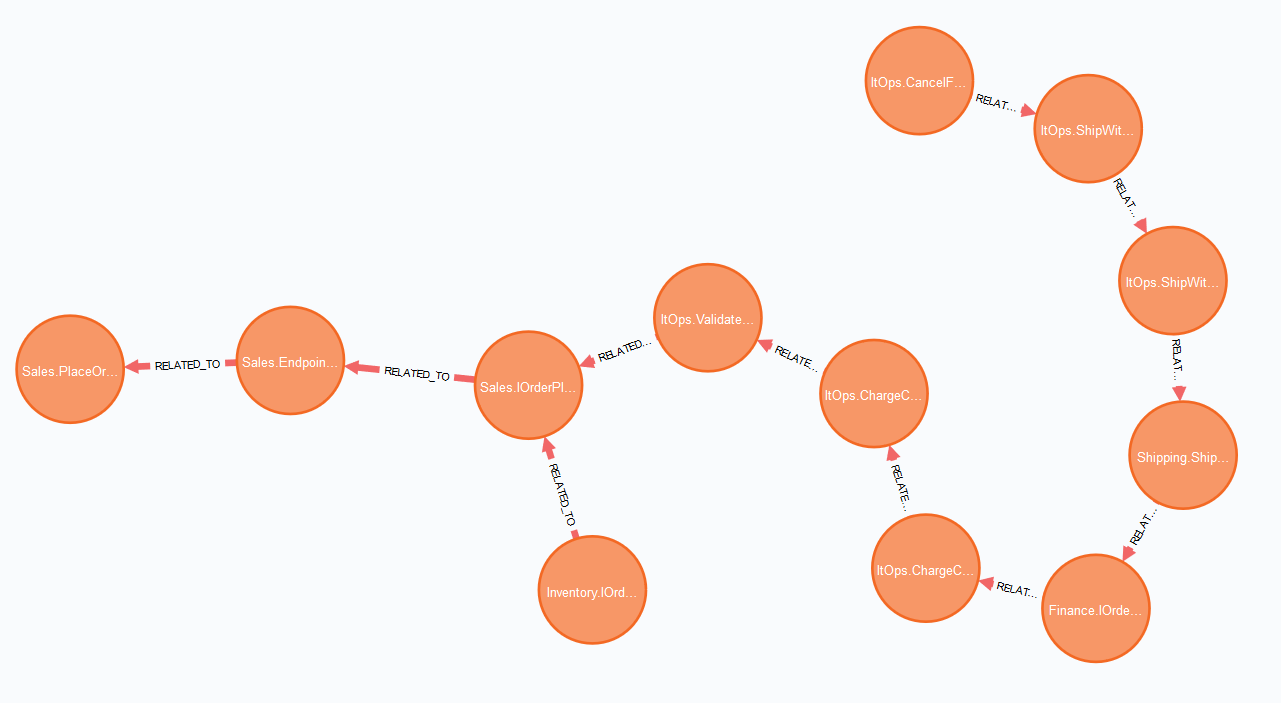
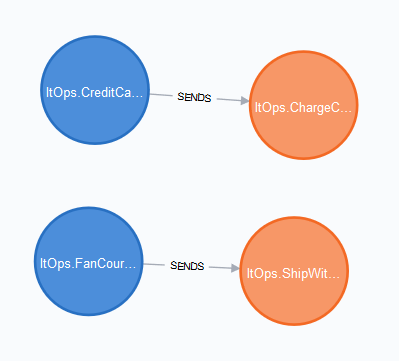
What messages is the ItOps service sending?
MATCH (e:Endpoint)-[:SENDS]->(m:Message) Where (e.id =~ 'ItOps.*')
RETURN e, m
Notice how we use a where clause with with a regular expression. We can do this because we use a naming convention: the name of an endpoint starts with the service name.
What messages trigger message Finance.IOrderCharged to be sent?
MATCH (m:Message {id:'Finance.IOrderCharged'})-[:RELATED_TO]->(related:Message)
RETURN m, related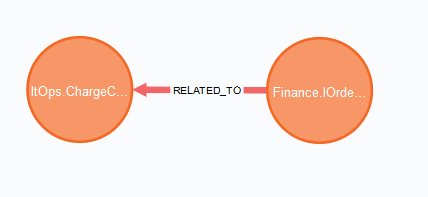
Show me the entire message flow that starts with the Sales.IOrderPlaced message
MATCH (m:Message)-[:RELATED_TO*]->(related:Message {id:'Sales.IOrderPlaced'})
RETURN m, related
Notice how we use * to specify that we want to return a Variable Length Relationship. This allows us to return the entire message flow.

Pros
- The main advantage is that you now have a queryable model.
Cons
- It’s a custom solution that you need to build and maintain.
- Since this model is generated by looking at the Message Store, you’ll need to regenerate the model every time you update the message flow (e.g. by adding or removing a message type).
- The out-of-the-box visualization that comes with the Neo4j Browser is not ideal because you can’t customize it too much. Of course, if the need arises, you could build your own visualization on top of the Neo4j database.
Conclusion
By building a runtime generated model you are in a better position to explore and understand a complex, message based system. Here are some things to keep in mind if you’re working on such a system:
Know the patterns
If you’re working on a messaging system, you should know the messaging patterns.
Use a message endpoint library
Why? Because you’ll probably need many of the messaging patterns. As Jimmy Bogard puts it, if you try to implement your own message endpoint library..
Consider building models
Why? Because, as Simon Brown says, models allow you to explore a complex system:
Consider the shape of data and the query patterns
When building the model (or any data store as a matter of fact), always look to see what data model is a natural fit. Also, think of the answers that you want to extract out of that model. This can help you put the data in the right schema.
I would love to see more examples of automatically building architecture models. If you know some, please leave a comment!