Lines of code, cyclomatic complexity, coupling, cohesion, code coverage. You’ve probably heard about these metrics before. But do you actively track them? Should you? Visual Studio computes some of these metrics out of the box. But if you want to define a custom metric, you’re out of luck. Yet, there are a bunch of code metrics that you might find useful for your code base. More so, a composite metric might be more helpful than the sum of its parts. For example, the C.R.A.P. Metric detects complex code that is not covered by unit tests. How can you track such a metric in Visual Studio? In this article we’ll see how to visualize code metrics, add custom metrics and how to monitor trends with NDepend.
Code Metrics
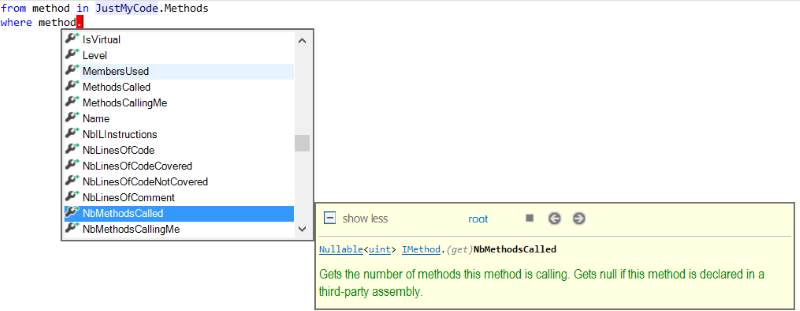
NDepend computes many metrics out of the box. You can use the intellisense support to discover the standard metrics for a given code element:

But it would be hard to extract information from these metrics if all we got was a bunch of numbers. We need other techniques to help us break down the complexity of the data. Visualization techniques complement metrics, by making it easier to synthesize and digest this information.