Lines of code, cyclomatic complexity, coupling, cohesion, code coverage. You’ve probably heard about these metrics before. But do you actively track them? Should you? Visual Studio computes some of these metrics out of the box. But if you want to define a custom metric, you’re out of luck. Yet, there are a bunch of code metrics that you might find useful for your code base. More so, a composite metric might be more helpful than the sum of its parts. For example, the C.R.A.P. Metric detects complex code that is not covered by unit tests. How can you track such a metric in Visual Studio? In this article we’ll see how to visualize code metrics, add custom metrics and how to monitor trends with NDepend.
Code Metrics
NDepend computes many metrics out of the box. You can use the intellisense support to discover the standard metrics for a given code element:
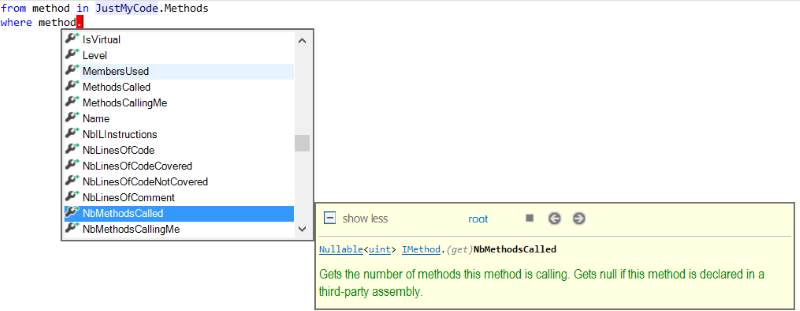
But it would be hard to extract information from these metrics if all we got was a bunch of numbers. We need other techniques to help us break down the complexity of the data. Visualization techniques complement metrics, by making it easier to synthesize and digest this information.
Treemaps
NDepend uses a visualization tool called a Treemap. A treemap displays hierarchical data through a set of nested rectangles. In the case of NDepend, the tree structure contains the basic elements of a code base: Assemblies, Namespaces, Types, Methods and Fields.
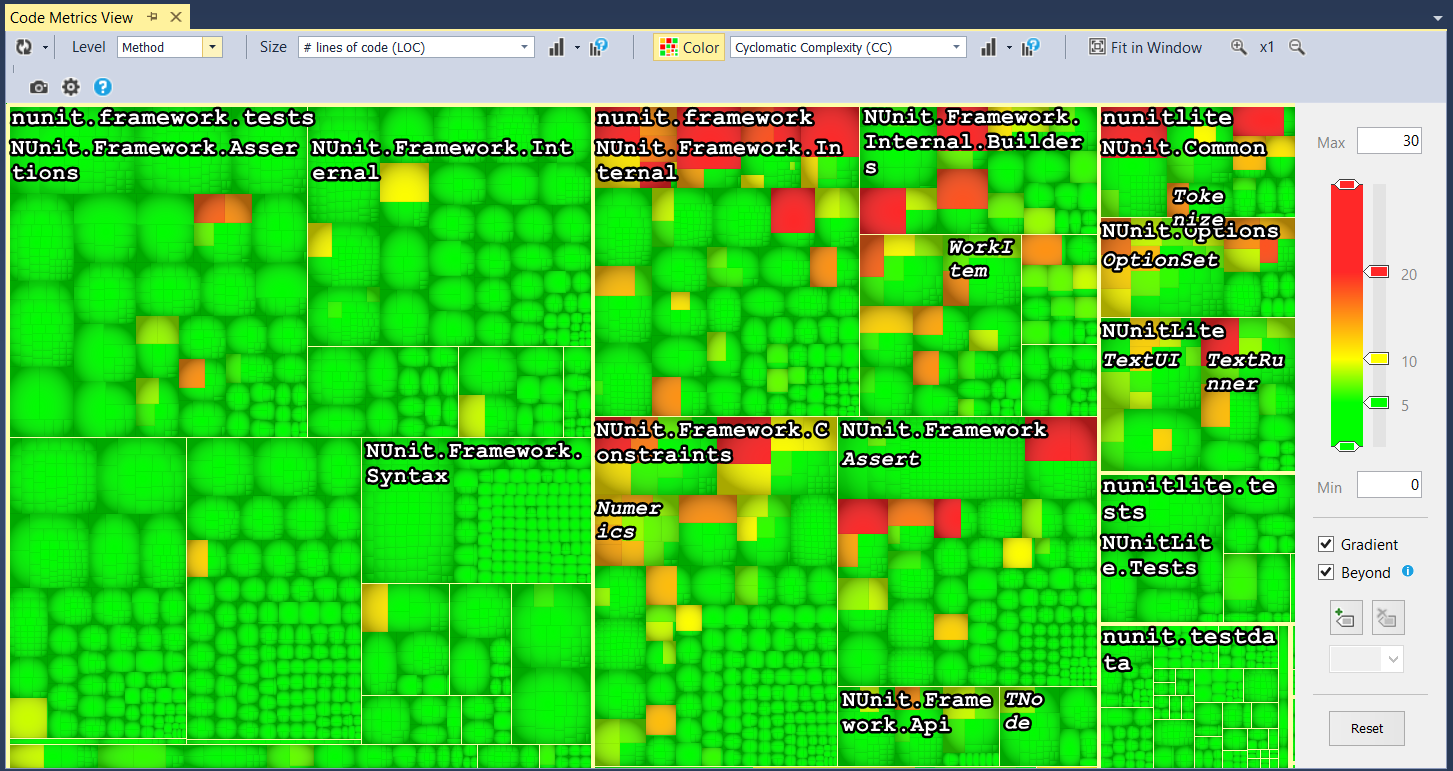
A Treemap is a good visualization tool because it relies on the visual attributes of the elements to display information:
- Code elements are grouped together under their parent (e.g.: types in a namespace, methods in a type).
- The Size and Color of an element can be configured to display different metrics. In the treemap above, the size is proportional to the number of lines of code, while the color indicates complexity.
It’s much easier to get an overview on a code base, with respect to a given metric, by inspecting the treemap. You can easily detect hot spots and get an idea of the density of problematic code elements. And since this is well integrated in Visual Studio, you can go from the treemap view to a code element by clicking on it. This allows you to zoom in on bits of code that need further investigation.
One useful feature is to select the top code elements, ordered by a certain metric.
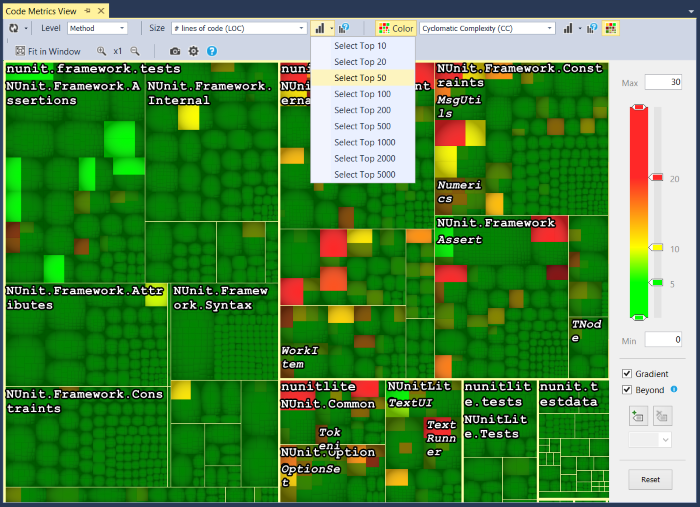
This will highlight the code elements on the treemap, as in the image above. NDepend does this by generating a CQLinq query:
(from m in Methods orderby m.NbLinesOfCode descending
select new { m, m.NbLinesOfCode }).Take(20)
This is yet another useful feature: when you write a CQLinq query, the results are highlighted in the treemap view.
NDepend’s code search functionality is also integrated with the code metrics view. The treemap updates on the fly, as you change the search parameters.
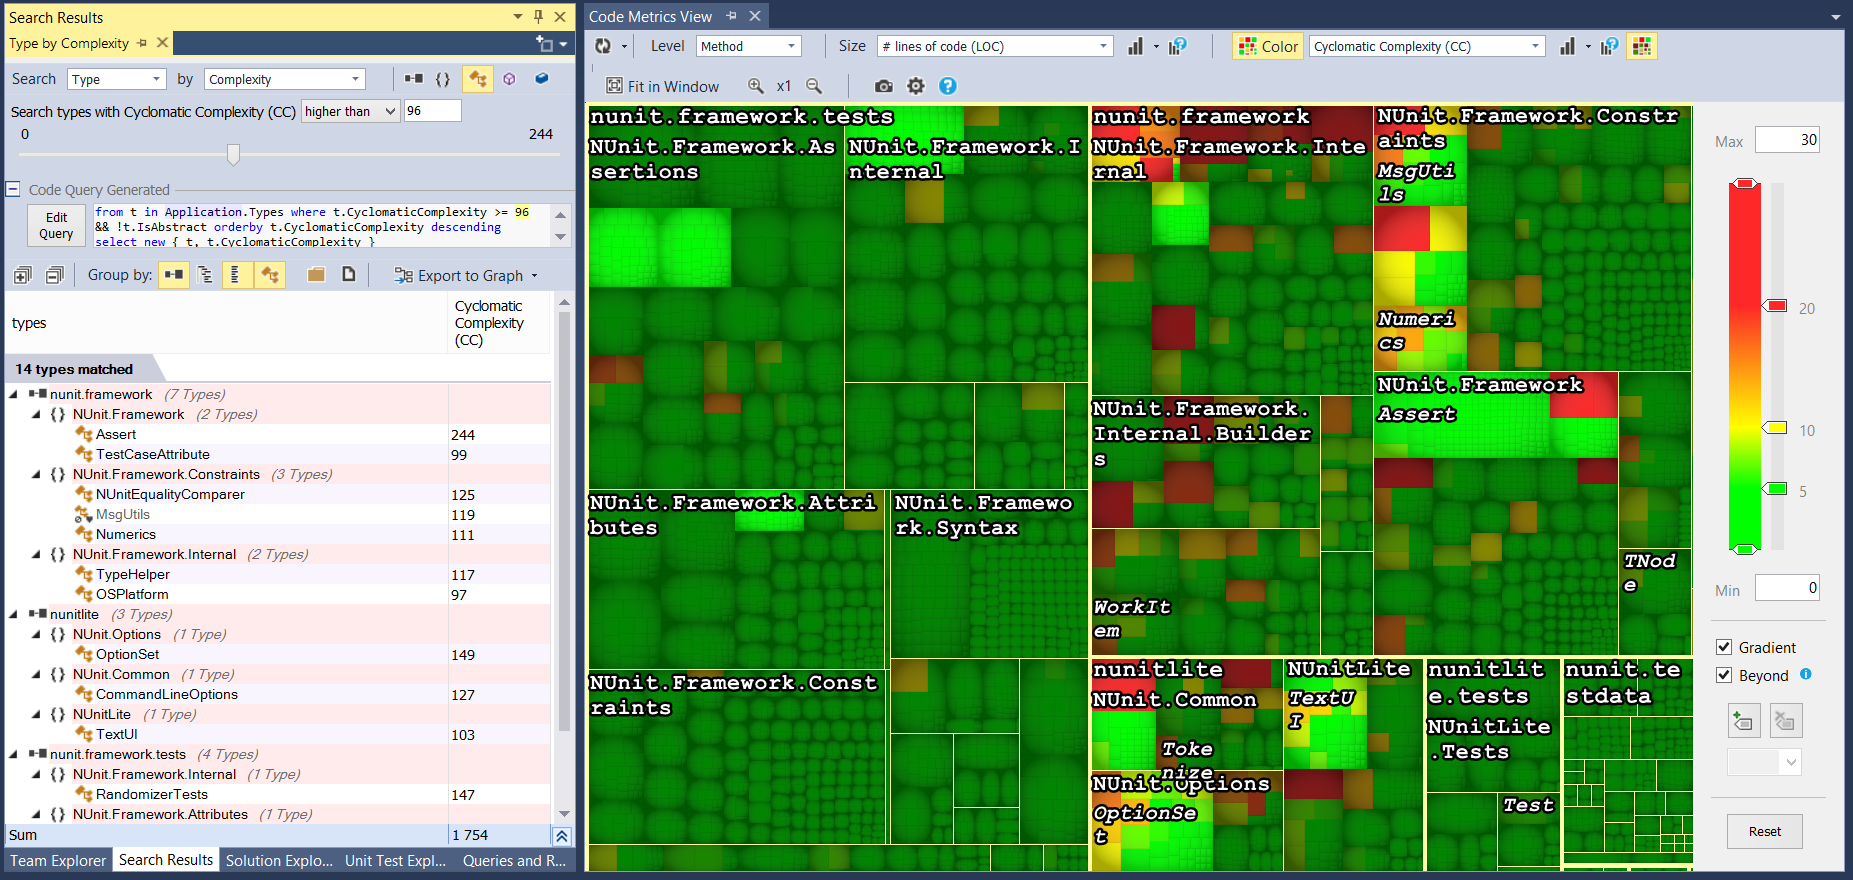
When you update a metric’s threshold by moving the slider, the treemap will change to match your criteria. This can help you set a threshold that is realistic for your code base. There’s no point in setting a low threshold that would match all of your code, since you wouldn’t know where to start cleaning it up. So you could put a higher threshold and lower it over time, as you refactor the code and improve its quality.
Simple Metrics
NDepend computes many of the well known code metrics and some novel ones.
Size and Complexity
NDepend computes a lot of size related metrics: number of lines of code, number of assemblies, number of types, number of methods, etc. This can help you understand how big the code base is.
For measuring complexity, NDepend uses Cyclomatic Complexity. This metric measures the complexity of a type or a method by calculating the number of branching points in code.
Coupling
Coupling is another important metric for object oriented code. NDepend computes Afferent or Incoming Coupling (Ca) and Efferent or Outgoing Coupling (Ce) for assemblies, namespaces, types, methods and fields.
The Association Between Classes (ABC) metric measures the number of members of other classes that a particular class uses.
Cohesion
Cohesion measures the strength of relationship between code elements. NDepend has two metrics for cohesion. Relational Cohesion is an assembly level metric that measure the average number of internal relationships per type. Lack of Cohesion Of Methods (LCOM) measures the cohesiveness of a type. A type is maximally cohesive if all methods use all instance fields.
Inheritance
For understanding how much is inheritance used in a code base, NDepend computes two metrics: Number of Children (NOC) and Depth of Inheritance Tree (DIT).
NOC counts the number of subclasses for a class or the number of implementations for an interface. DIT counts the number of base classes (starting from System.Object).
Other
In order to display the Abstractness vs. Instability graph, NDepend also computes the Abstractness and Instability metrics for an assembly.
The Rank metric applies the Google Page Rank algorithm on the graph of dependencies for a type or a method. Changing a code element with a higher rank will have a bigger impact, so the change should be thoroughly tested.
Creating Custom Metrics
Although all these metrics are important, I think that the ability to easily define custom metrics is even more important. To showcase this, let’s implement two metrics described in Object-Oriented Metrics in Practice by Michele Lanza and Radu Marinescu. I picked two metrics that analyze how inheritance is used across the code base: Average Number of Derived Classes and Average Hierarchy Height.
ANDC – Average Number of Derived Classes
This characterizes the width of the inheritance tree by computing the average number of direct subclasses of a class.
JustMyCode.Types
 .Where(t => !t.IsInterface)
 .Average(t => t.DirectDerivedTypes.Count())
AHH – Average Hierarchy Height
This is the average of the Height of the Inheritance Tree (HIT) for root classes. A class is a root if it is not derived from another class in the system. This metric characterizes the depth of the inheritance tree.
let justMyTypes = JustMyCode.Types.ToHashSet()
let rootClasses = JustMyCode.Types.Where(t =>
 !t.IsInterface &&
 // a root class cannot have its base class in the system
 t.BaseClasses.Intersect(justMyTypes).Count() == 0)
let hitSum = rootClasses.Sum(c =>
 // the maximum path from the root to its deepest subclass
 c.DerivedTypes.Max(d => d.DepthOfDeriveFrom(c)))
let rootCount = rootClasses.Count()
let ahh = (double?) hitSum/rootCount
select ahh
As you can see, it is quite easy to compute both metrics by relying on CQLinq. It would certainly be much harder without it.
Trend Metrics
So now you know how to define a set of metric that you consider important. You will probably want to monitor trends over time. This can tell you if you’re moving in the right direction or if your code base is starting to rot. In NDepend you can use Trend Charts to plot the evolution of a metric over time.
In order to use a certain metric in a trend chart, it has to be defined as a trend metric. You can see default trend metrics under the Trend Metrics group in the Queries and Rules Explorer view.
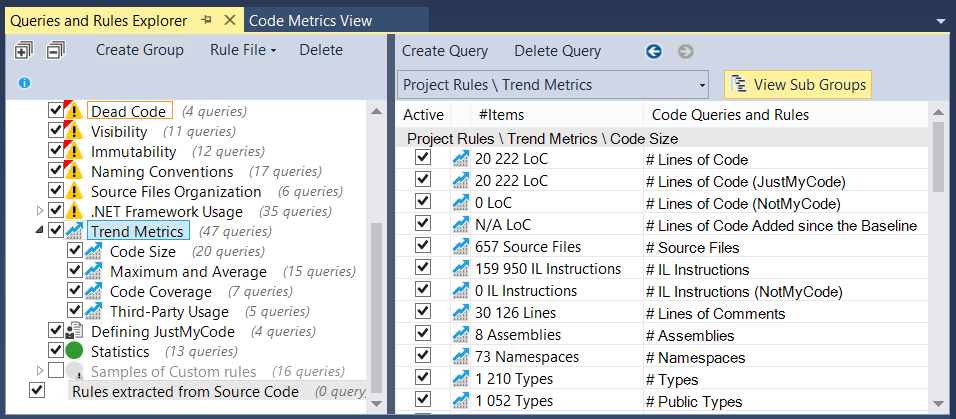
You can define custom trend metrics by using a special formatted header comment. Here is the definition for the ANDC trend metric.
// <TrendMetric Name="ANDC" Unit="Derived Types" />
JustMyCode.Types
 .Where(t => !t.IsInterface)
 .Average(t => t.DirectDerivedTypes.Count())
Conclusion
Code metrics are important. They can help you get an objective assessment of a code base. Although each metric in isolation can provide only a limited amount of information, several correlated metrics can tell you a lot more. NDepend makes it easier to identify code smells through custom and composite metrics, tailored for your context. By monitoring metrics and trends, visualizing dependencies and querying your code base, you can get an overview of the quality of your code base and where to start improving it.
Pingback: Computing the Overview Pyramid metrics with NDepend - Simple Oriented Architecture